More people are missing out on the benefits they’re entitled to (we think)
November 21, 2023 –
Without much fanfare, the first benefit take-up statistics since the pandemic were published by the DWP at the end of last month. It’s happened too many times to say “unbelievably”, but as in previous years the statistics only cover pension age benefits and still don’t include an estimate for take-up of Universal Credit (UC).
We said it before in our blog calling for UC statistics to be published, but this is tantamount to giving up on promoting benefit take-up completely. At least for working age people that is. As is the case in so much of benefit policy, pensioners remain protected, with take-up encouraged by DWP and statistics published.
As new statistics are available, we’ve taken the opportunity to update our number for the amount that goes missing in unclaimed benefits. For consistency we’ve kept our methodology the same as in previous years and focused our analysis on means-tested benefits where official statistics have been published at some point (except, of course, for UC). This means some benefits, like Carer’s Allowance or Personal Independence Payment, aren’t included. Nor do we include social tariffs and the like.
Our new estimate is that £16bn of benefits goes unclaimed (see breakdown in the table below), which is up on our previous estimate. That’s partly because more pensioners are missing out, according to the latest official estimates. But it also includes the £900 cost-of-living payment that eligible people are missing out on, as well as the effect of inflation.
|
Benefit name |
Date of data used |
Number of entitled families not claiming |
Amount unclaimed |
|
Council Tax Support |
2009/10 |
2,770,000 |
2,800,000,000 (a) |
|
Child Benefit |
To Aug 2022 |
770,000 |
1,400,000,000 |
|
Housing Benefit |
2021/22 |
310,000 |
1,000,000,000 |
|
Pension Credit |
2021/22 |
800,000 |
1,700,000,000 |
|
Universal Credit |
To April 2022 |
1,165,000 |
7,400,000,000 |
|
Cost of living payment |
n/a |
1,965,000 |
1,700,000,000 |
|
Total |
|
5,815,000 (b) |
£16,000,000,000 |
Table 1: entitledto's estimates unclaimed means-tested benefits
Further notes:
All figures, where available, are based on central estimate figures for entitled non-recipients (people who are eligible to claim but for some reason don’t).
(a) Using the mid-point of the total amount of Council Tax Benefit unclaimed in 2009/10 (between £1.7 billion and £2.42 billion) this figure has been inflated to April 2022 prices using the Bank of England Inflation Calculator.
(b) Not unique families, as some may be entitled to more than one benefit.
What we know about take-up: pensioners
For pensioners, the only group examined in DWP’s statistics, the latest take-up estimates show that in 2022 more households were missing out on benefits they could claim. After take-up rates for Pension Credit improved in the couple of years before the pandemic, the latest statistics suggest take-up has declined a little.
Using DWP’s central estimate, in 2022 around 63% of pensioners who were entitled to Pension Credit claimed it. This is 3 percentage points lower than the previous estimate of 66%, which, because of the pandemic, is for 2020. Given the knock-on effects of the pandemic on benefits administration this is perhaps not too surprising, and for Pension Credit (if not Housing Benefit for pensioners), it only returns the take-up rate to its 2019 level.
We won’t be sure for another year, but our expectation is that the most recent statistics are a blip and that take-up rates for Pension Credit will improve in future years. As well as the effect of the pandemic unwinding, there are encouraging signs that DWP’s take-up campaign for Pension Credit is working. Though unfortunately, one of these signs is extended waiting times between applying for the benefit and the first payment being made (as reported in a survey of benefit advisers in March 2023).
In addition, the effect of the Cost-of-Living payments may also be an important factor in promoting take-up. As highlighted in our blog on the Cost of Living payments and benefits take-up, the deadline for making an application may motivate more pensioners to claim the benefits they are entitled to.
It means that, for instance, people who are eligible to claim Pension Credit but don’t get it today have until 10 December to make their application and receive a ‘bonus’ £300 Cost of Living Payment.
What we know about take-up: Child Benefit
As well as estimates for Pension Credit, statistics on take-up of Child Benefit have also been maintained as a constant series by HMRC (who administer the benefit). They show a very clear trend: the number of families missing out on Child Benefit is growing rapidly.
The government’s statisticians are commendably honest about the issue and its cause. They comment: “since 2012 the take-up rate of eligible children for whom Child Benefit is claimed has reduced steadily year on year, from a high of 97% in 2012 to its lowest level in 2022 of 89%. This is likely related to the introduction of HICBC (High Income Child Benefit Charge) in 2013, which meant that some families no longer claimed Child Benefit.”
The growth in the number of families missing out on Child Benefit looks set to increase, as take-up rates for families with children born since the introduction of the HICBC are even worse. The estimates show that, despite the fact that Child Benefit is meant to be a ‘universal’ benefit, a quarter of parents with children under one are missing out on their entitlement. That’s well below the 84% level of take-up that Child Tax Credit achieved towards the end of its life, despite the fact that it is a ‘targeted’ benefit.
What we might know about take-up: Universal Credit
Due to the lack of published data for UC and other working-age benefits we have had to look outside government to get an insight into how take-up rates might be changing.
The University of Essex research 'Analysis of benefit take-up using UKHLS and UKMOD’ (pdf) in effect replicates the work of government statisticians on take-up of Pension Credit and Child Benefit, but uses a new methodology and different data so that working-age benefit take-up rates can also be estimated.
Unlike official statistics, which use the Family Resources Survey’s annual ‘snapshot’ of the population, the university’s research is based on the first nine waves of the UK Household Longitudinal Study (UKHLS). The main results are shown in the graph below, reprinted from that research.
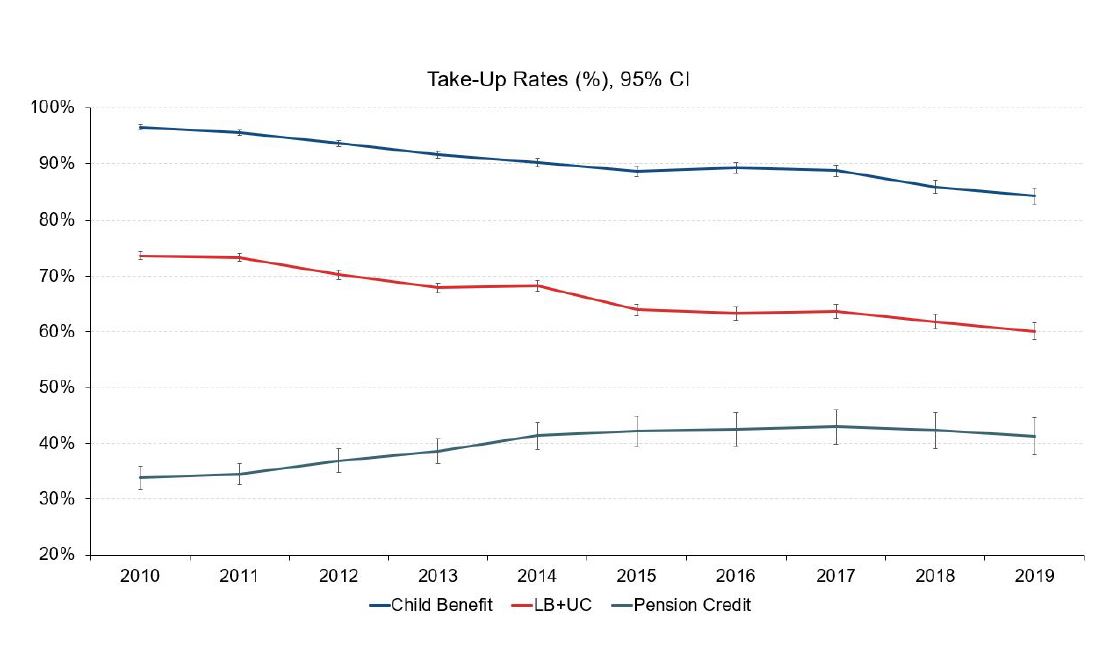 Table 2: Analysis of benefit take-up using UKHLS and UKMOD - University of Essex - June 2023 (slide 19)
The research shows that, for Pension Credit, there is a substantial difference with official statistics, with the UKHLS research showing lower take-up rates (of around 40% compared to the DWP’s 65%) but also a steady improvement during the 2010s. More reassuringly, for Child Benefit, it shows a very similar level and pattern of take-up to the official statistics.
For Universal Credit, because of the gradual transition from so-called ‘legacy’ benefits to UC, the research finds that it’s not possible to divide analysis between the two and a series that combines these benefits is presented. The effect is to report on the take-up of working-age means-tested benefits, which, according to the UKHLS, has steadily declined during the 2010s.
Tentatively, and with suitable caveats about the data being new and unofficial, we can only conclude the steady decline means the problem of working-age people missing out on benefits is getting worse. Despite the claims made when it was launched in 2013, it seems that UC has made it more, not less, likely that people will miss out on benefits they are entitled to.
