Our annual review suggests about £15 billion of benefits remain unclaimed each year
February 25, 2022 –
Every year entitledto delves into the world of benefit take-up rates, to see if any progress is being made in the amount of income-related benefits being left unclaimed by those entitled to them.
As we reported in our recent Don’t take away our take-up stats blog, the DWP announced a few weeks ago that this set of take-up data (for the 2019/20 benefits year) would report only on rates for pension age income-related benefits. The data was released yesterday.
The challenge: How to add Universal Credit data to our analysis
This year, with the advance knowledge of a reduced data set and in the absence of official statistics, we put our minds to ways we could try and create our own estimate for lost income from people not claiming Universal Credit (UC). With the gap in UC take-up data becoming ever longer, we felt an increasing percentage of people, and pounds, were potentially being left out of the story that should be included in our analysis.
The problem is illustrated by last year’s statistics, where we reported a reduction in the amount of income lost through incomplete take-up (we estimated around £1 billion less in unclaimed benefits from the year before). However, we believe this reduction is largely a statistical anomaly created by the migration of households onto UC.
The take-up estimates for 'legacy' benefits we reported last year all showed a marked improvement; for instance the amount of income lost in unclaimed Income Support / Employment Support Allowance fell in two years from £2 billion to £1 billion[i]. In return there should have been a new estimate for unclaimed UC, but no estimate was published and we did not make any adjustment ourselves.
Our aim was to correct this problem this year but when we sat down to try and map the available data we weren’t able to come up with one clear way of outlining our assumptions. We have therefore taken the decision to provide two methodologies in this year’s report.
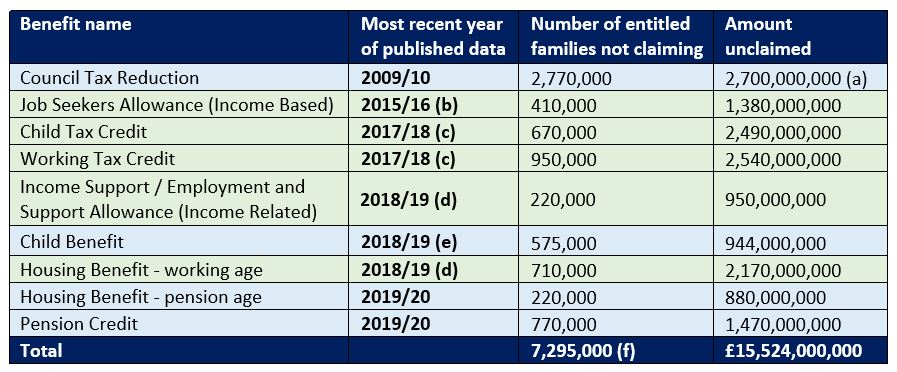
Option 1 – Include data about legacy benefits take-up but not Universal Credit
This is the option we have used in our previous annual take-up reports, and our main estimate this year. Using only published data provides more clarity about the provenance of our estimates but, as we have been saying for years, the lack of relevant up-to-date statistics makes it feel out of date. This will hopefully be the last year we need to include this option, as we assume that statistics on UC take-up will be published next year.
It’s important to note: Older legacy benefits are shaded in green in the table below. New claims for these benefits are only possible in very exceptional circumstances and most people need to claim Universal Credit instead. Blue shaded benefits are still open for new claims.
Notes:
All figures, where available, are based on central estimate figures for entitled non-recipients (people who are eligible to claim but for some reason don’t).
(a) Using the mid-point of the total amount of Council Tax Benefit unclaimed in 2009/10 (between £1.7 billion and £2.42 billion[ii]) this figure has been inflated to 2020 prices using the Bank of England Inflation Calculator.
(b) DWP stated “At this point in the UC rollout schedule, there is no practical way to distinguish between JSA and UC at entitlement level for the purposes of estimating take-up statistics. Therefore, the JSA data are not of a suitable quality to be published."[iii] The figures have not been inflated as benefits rates have mostly been frozen since this date.
(c) HMRC stated “Due to the introduction of Universal Credit, this is the final year for which tax credit take-up statistics will be released.”[iv] The figures have not been inflated as benefits rates have mostly been frozen since this date.
(d) DWP stated it would “remove reporting on working age take-up from the next publication and focus only on pensioner age take-up.[v]” We have not inflated these figures as benefits rates have mostly been frozen since this date.
(e) This data set is still being updated but the most recent data is from 2018/19. 2019/20 data will be released in March 2022.[vi] The figures have not been inflated as benefits rates have been frozen since this date.
(f) Not unique families, as some may be entitled to more than one benefit.
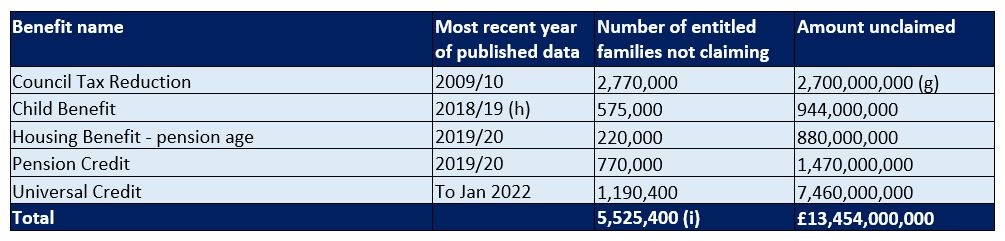
Option 2 – Include our own interpretation for Universal Credit take-up and remove the older (published) data about legacy benefits
To estimate the amount of unclaimed UC we have assumed that take-up rates for the new benefit are the same as the average for the six legacy benefits it replaces, with about 25% of eligible households failing to claim their entitlement. Based on the most up-to-date number of households claiming UC and the average (mean) amount of UC paid to households (January 2022, when 4.8 million households were on UC and the average payment was £780) we estimate this equates to almost £7.5 billion unclaimed.
We think this estimate broadly equates to the reduction in take-up estimates that is an unintended by-product of migration from legacy benefits to UC. We accept, of course, that it involves some speculation and if the DWP provided their own statistics on UC take-up we would of course use these instead.
All benefits are shaded blue in the table below and therefore open for new claims.
Notes:
All figures, where available, are based on central estimate figures for entitled non-recipients (people who are eligible to claim but for some reason don’t).
(a) Using the mid-point of the total amount of Council Tax Benefit unclaimed in 2009/10 (between £1.7 billion and £2.42 billion[vii]) this figure has been inflated to 2020 prices using the Bank of England Inflation Calculator.
(b) This data set is still being updated but the most recent data is from 2018/19. 2019/20 data will be released in March 2022.[viii] The figures have not been inflated as benefits rates have been frozen since this date.
(c) Not unique families, as some may be entitled to more than one benefit.
Why we need up-to-date take-up data
The DWP’s failure to provide statistics on working-age benefit take-up this year must not become permanent. The act of publishing data makes the problem of low benefit take-up visible, and conversely failing to publish can too often lead to a failure to acknowledge the problem. Moreover, we can’t learn lessons about social security design without knowing what’s happening to take-up rates.
The recent history of Council Tax Benefit (CTB) illustrates these problems. Because CTB was localised in 2013, and no longer connected to the DWP, it was the first of the take-up statistics to be axed. As far as we are aware no take-up statistics have ever been produced on any of the new local schemes. As expected, this means the issue of take-up is often not considered when local authorities’ review their schemes.
Moreover, because we are unable to say whether take-up of the localised schemes is better or worse than under CTB, we can’t draw proper conclusions about the pros and cons of this benefit reform.
Ironically, HMRC’s continued publication of Child Benefit take-up statistics shows how useful these estimates can be, helping to highlight the growing problem of reduced take-up of this benefit since the 'High Income Charge' was introduced in 2013.
For individuals, it means there should be clear advice to claim Child Benefit and then repay it through the income tax system when the time comes: at worst people affected by the High Income Charge will receive an interest-free loan from the government, and they could be one of the half a million families missing out. For policy evaluation, the take-up statistics clearly illustrate the fact that selectivity (of any form) reduces benefit take-up.
Help us encourage everyone to check if they are entitled, now!
Until such time as the DWP decides to publish a full set of take-up statistics we will continue to provide our estimates to encourage people to check their entitlements.
Our free tools are here to help people quickly work out what support they may be entitled to. Please do please share them with friends and family so they can check what help they may be able to claim.
Sources:
[i] https://assets.publishing.service.gov.uk/government/uploads/system/uploads/attachment_data/file/222914/tkup_first_release_0910.pdf
[ii] https://www.gov.uk/government/statistics/child-benefit-statistics-annual-release-august-2020
[iii] https://assets.publishing.service.gov.uk/government/uploads/system/uploads/attachment_data/file/222914/tkup_first_release_0910.pdf
[iv] https://www.gov.uk/government/publications/income-related-benefits-estimates-of-take-up-financial-year-2018-to-2019/background-information-and-methodology-2018-to-2019
[v] https://www.gov.uk/government/statistics/child-benefit-child-tax-credit-ctc-and-working-tax-credit-wtc-take-up-rates-2017-to-2018
[vi] https://www.gov.uk/guidance/income-related-benefits-estimates-of-take-up-fye-2020-statistical-notice
[vii] https://www.gov.uk/government/statistics/child-benefit-statistics-annual-release-august-2020
[viii] https://www.gov.uk/government/statistics/income-related-benefits-estimates-of-take-up-financial-year-2018-to-2019
